How to Use Your Histogram on Your Camera

Photography is quite a typical thing when you are doing it right. If you think it is all about pressing the shutter button, you are wrong. There are a large number of essential things you should keep in mind and utilise them in a perfect way to make the most out of a shot.
This article is going to be all about Histogram. However in order to be able to use your histogram, you should learn how to use it first. Let us start by discussing the fundamentals of reading the histogram.
What is a histogram and how important is it for improving the quality of your photo?
In a broad sense, a histogram of a specific image gives you precise information about the tones at different levels of brightness in the same image. You can get the exact idea about how many pixels a particular tone in the image has?
Most commonly, a large number of beginners ignore histograms because they think it to be complex however in reality, it is not. It is a rather simple thing to understand. Be with us for a few moments as we discuss the fundamentals.
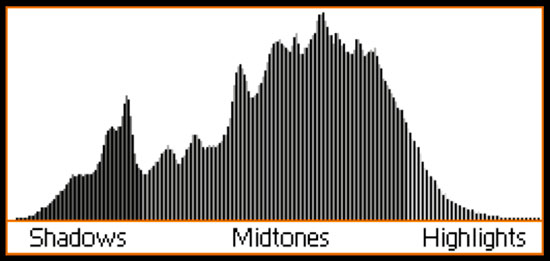
Talking of the tonal values, 0% brightness means black while 100% brightness refers to white. There are different portions of a histogram that depict different levels of brightness. The left side of the histogram is used to depict black while the right side refers to white.
And in the middle lie the regions that are neither black nor white instead, they represent the combination of both these colours.

An example histogram on camera (Source)
Understanding the histogram more detail
As we already told you, the left of the histogram represents black while the right represents white. However there are several other details that need to be noticed when you want to use your histogram.
Now you will see a large number of spikes originating from different locations on the horizontal lines. Those spikes represent the number of pixels available in that particular tone.
What has a histogram to tell you about the image?
Since a histogram is all about the image, it is very necessary to learn about grasping the information contained in the histogram about your image. In fact, you can learn a lot of things about the image by just looking at its histogram. Here are some signs that will tell you the following things about the image.
- If the graph extends from edge to edge without any gap, you should know that the image is very well-exposed.
- When you see the graph going upside on any side of the graph, the image is not well-exposed.
- Apart from that, an image with an ideal exposure mostly has a nice arch in the middle.
The histogram figures may vary based on the light intensity in the surroundings. So, the graphs vary a lot based on the type of image you have shot and the availability of light around there.
What if you see spikes on the right or left side of the graph?
It is quite a common configuration that you may find in a lot of histograms. Knowing the real meaning of it will help you a lot in understanding the image better. When you see spikes on the right or left side of the graph, it means that the specific tone has been clipped.
The image will not have details in those areas as a result of the clipping. That is why you should try to expose the image so that details won't go missing.
You can retain the shadows and other details like that in an easy way. On the contrary, you won't be able to highlight any portion of the image to include details in it. The light should be right in the image file in order to appear in the image otherwise, there is no way to create it from your side.
Want to earn money from your hobby?Sign up free as a Stockphoto.com contributor today!
|
Understanding exposure with the help of histograms
Though the histograms provide a wide range of knowledge about the image like information about its colour channel and many other things. However you get the most information about exposure of the image.
There is a very simple way to get some idea about it here. A good histogram will always contain the most tones in the middle of the graph. However whenever you find the majority of tones lying near the edges of the graph, you should know the exposure of the image is not up to the mark.

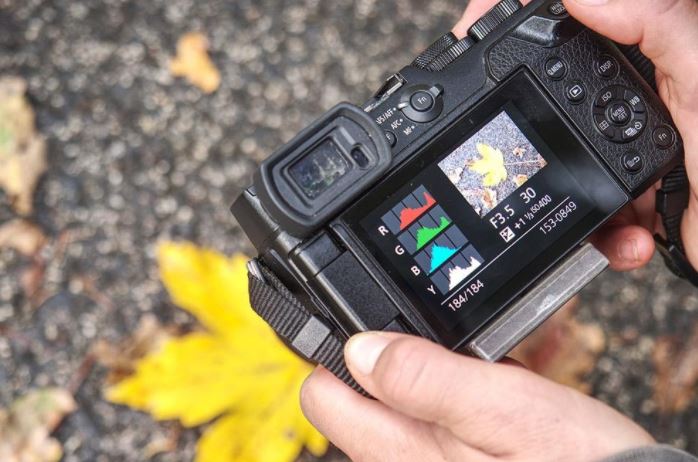
Viewing a histogram on a camera screen (Source)
How can you use your histogram?
If you want to use your histogram, it can be found very easily while you are reviewing the images. Apart from that, if the camera is in live-view shooting mode, the histogram can be used to help with getting great composition. In that case, you can either use it through the LCD screen or if you have a mirrorless camera, you will find the histogram in the electronic viewfinder.
No matter which camera you have, always keep in mind that the feature to use histogram is turned off by default in most cameras. You need to change the settings in order to use it.
Some important things to keep in mind here
Relying on graphs and other numbers completely is not a good thing for experts, in fact, the experts never do it. You may need such features in the beginning however these features will not take you to the top.
The histogram gives you a lot of information however you have to keep in mind this graph and numbers are completely unaware of the context in which you are taking the shot. Suppose you have shot a picture that is perfect when underexposed, the histogram will convince you that the exposure is not right in this case.
So, it is only you who can understand and grab the best knowledge out of a histogram. This is because you are well aware of the context, your surroundings, and other essential aspects of the image.
Photographers! Earn a $200 Sign up Bonus... |
|---|
Interested? Sign-up here(more details) |
Final words
We hope this article helped you to use your histogram in photography. Knowing these fundamentals will enable you to use the histograms in a far better way while editing as well. Remember that a creative photographer always has some room for their imagination and creativity.
About the Author
Emma Taylor is a writer, wine aficionado and live theatre tragic. When not writing guest posts, she can be found with her two cats and a glass of Australian wine.


